Latency, jitter and packet loss look different on your side
Tell latency from jitter from loss in your monitor
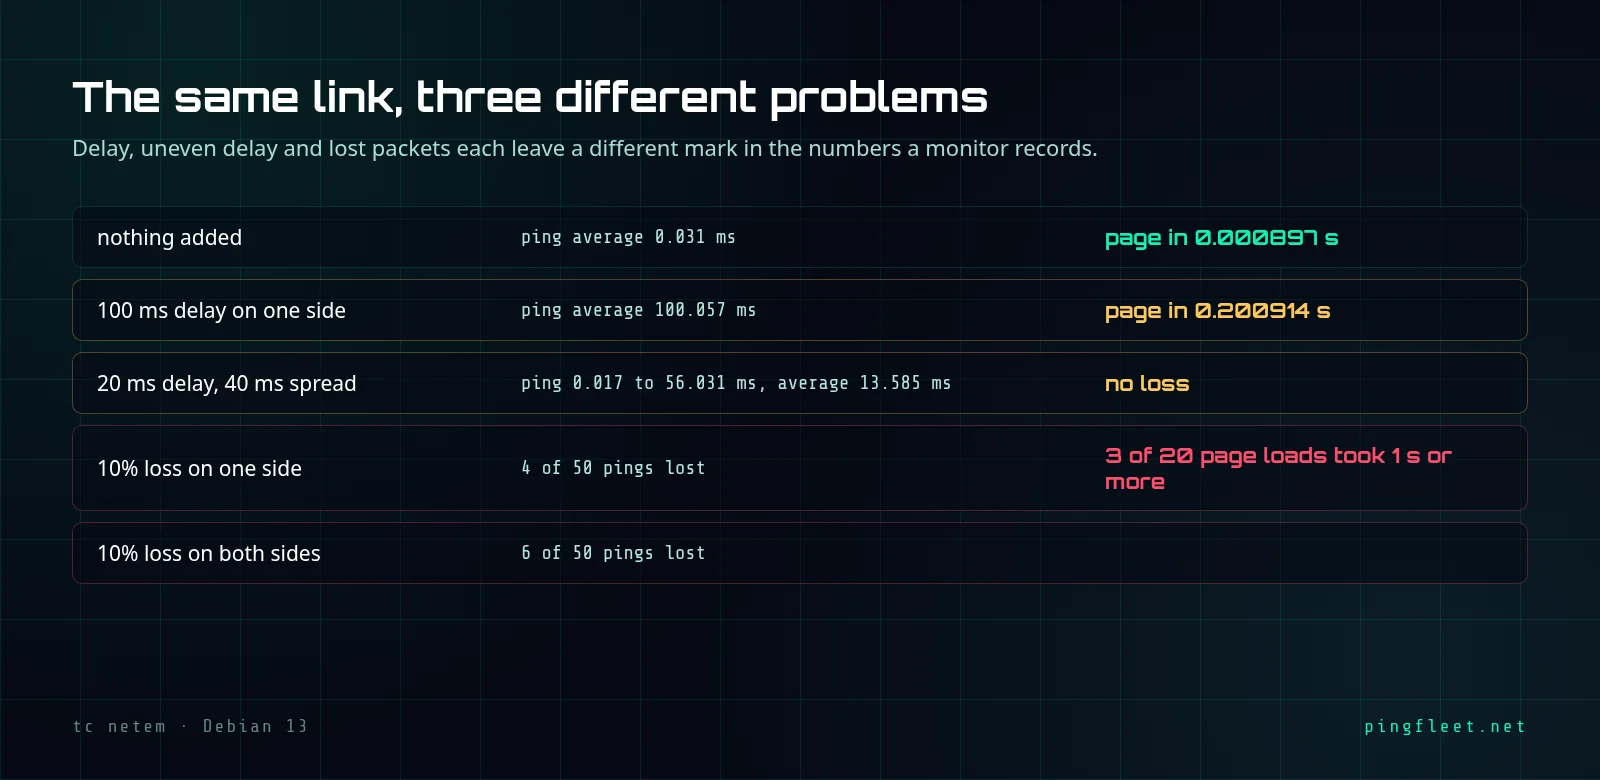
A clean link takes 0.031 ms
I set up two network namespaces on a disposable test VM and connected them with a virtual cable. Then I pinged across. The 20 packets came back with 0 percent loss, averaging 0.031 ms round-trip, and an HTTP request to a small TCP server on the other end finished in 0.000897 seconds. No real network was involved, just two halves of the same kernel talking through a software link.

What does latency look like?
I added 100 ms of delay on one side of the link. Every ping came back at almost the same time: 100.057 ms average, deviation 0.005 ms. The HTTP request went from 0.000897 seconds to 0.200914 because each of the 2 round trips in an HTTP exchange now carried the extra 100 ms.
That is what latency looks like in a monitor: a flat line that shifted up. It stays there. If your site loads in 2 seconds and the number barely changes between checks, you are looking at latency somewhere on the path between your server and the visitor.
Jitter makes every measurement different
I configured 20 ms of average delay with a spread of 40 ms. I assumed the average would land close to 20 ms.
The measured average was 13.585 ms, not 20. Minimum was 0.017 ms, maximum 56.031 ms, deviation 18.523 ms, all in 20 packets. One ping came back in 35.7 ms, the next in 0.032 ms, then 0.031, then 8.29, then 4.84. I think the average came out below 20 ms because the spread can push computed delays below zero and those get clipped, but I did not verify that.
In a monitoring dashboard, jitter looks like a jagged line. Your visitor cannot predict which response time they get, because consecutive checks can return 0.032 ms and 47.4 ms.
What does loss do to a page load?
I set 10 percent packet loss on one side of the link and ran 50 pings. Of those, 46 came back. That is 8 percent, not the 10 I configured. Fifty packets is a small sample and a gap like that is expected.
Loss does not slow down the packets that arrive.
But HTTP told a different story. Out of 20 requests to the same TCP server, 3 took 1.024238, 1.029876 and 1.222880 seconds while the fourth and fifth slowest finished in under 1 ms. TCP resends a lost segment and waits at least 1 second before retrying, so any request that hit a dropped packet stalled for that long. If the other 17 were near zero, a monitor that only reports averages would show roughly 0.16 seconds per request and would hide the fact that 15 percent of page loads waited a full second.
The return path adds its own loss
I added 10 percent loss on the near side too, so packets could now be dropped in either direction. The ping statistics line showed 12 percent loss out of 50 packets, up from 8 percent with one side only. Those probabilities stack: a packet can be lost on the way there or on the way back.
What the ping summary tells you
The field that separates latency from jitter in a ping summary is mdev, the standard deviation of all round trips. When mdev reads 0.005 ms, every packet took roughly the same time. When it reads 18.523 ms, consecutive packets differed by tens of milliseconds. Loss is the one mdev does not catch: the packets that arrive travel at normal speed, and the missing ones leave no timing data.
For those who want the details
The test ran on Debian 13 (trixie), kernel 6.12. Two network namespaces (near and far) were connected by a virtual Ethernet pair with addresses 10.20.30.1 and 10.20.30.2. A TCP server ran in the far namespace.
Impairments were applied with tc and the netem queueing discipline on the far side of the link. The tc-netem man page documents all the parameters.
Baseline (no impairment):
  ping -c 20 10.20.30.2
  rtt min/avg/max/mdev = 0.029/0.031/0.037/0.002 ms
  HTTP 200 total 0.000897s connect 0.000098s

Latency (100 ms delay, one side):
  rtt min/avg/max/mdev = 100.044/100.057/100.075/0.005 ms
  HTTP 200 total 0.200914s connect 0.100185s

Jitter (20 ms delay, 40 ms spread):
  rtt min/avg/max/mdev = 0.017/13.585/56.031/18.523 ms
Loss (10% one side, 50 pings):
  50 transmitted, 46 received, 8% packet loss
  Slowest 5 HTTP of 20: 1.222880, 1.029876, 1.024238, 0.000742, 0.000715 s

Loss (10% both sides, 50 pings):
  50 transmitted, 44 received, 12% packet loss
The netem kernel module was loaded with modprobe before the first impairment could be applied. The baseline of 0.031 ms confirms that the virtual cable between namespaces adds almost no delay on its own, so every measurement above that came from the configured impairment alone.