Features
Features
Ten kinds of check, two places to run them from, and one map that shows how they connect.
The map
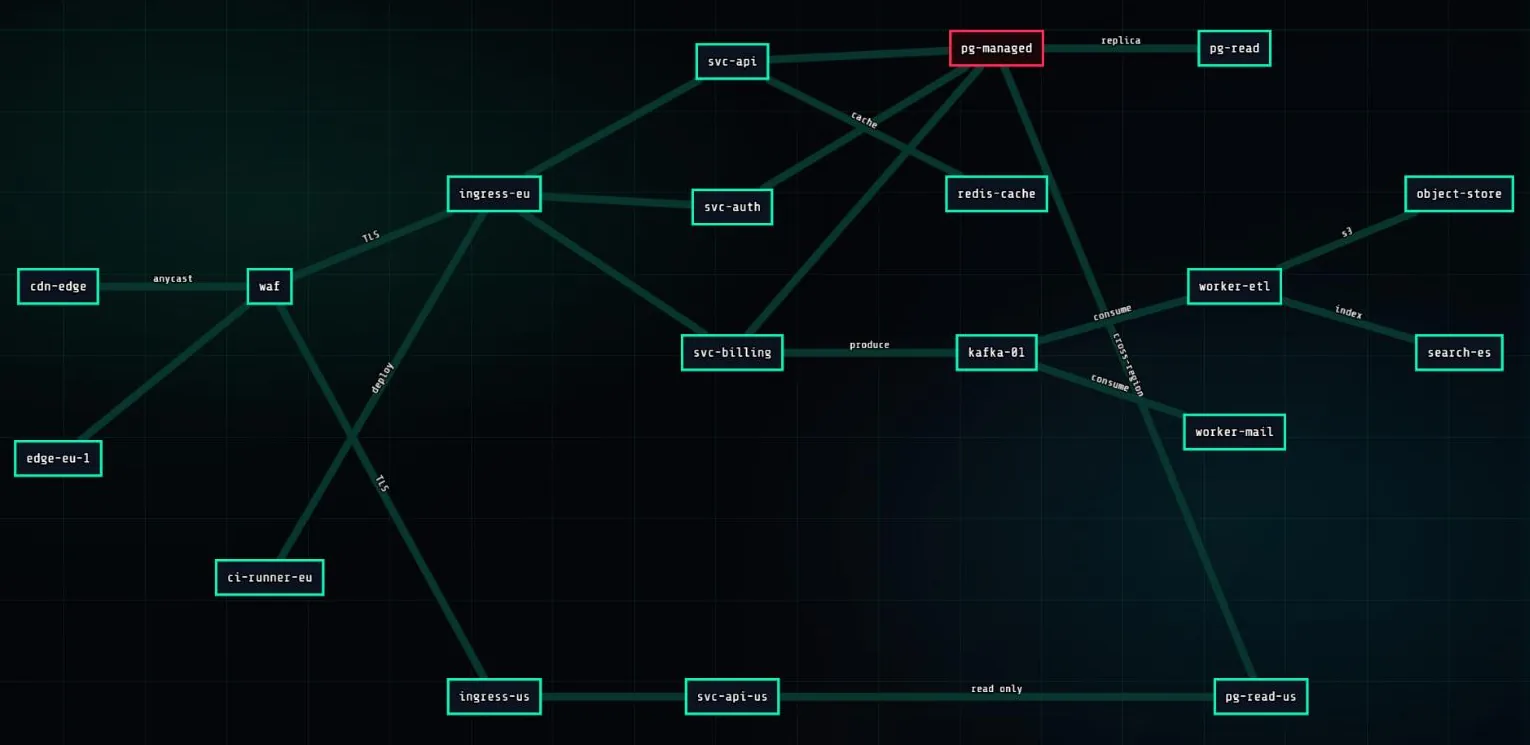
Your infrastructure as a graph
Hosts, services and the links between them, coloured live. You place the nodes once; the arrangement is yours.
- Waypoints for the hops between two monitored things
- An embed mode with no navigation, for a wall display
Ten monitor types
HTTP and HTTPS
Status code, response time, and a string that must appear in the body. Custom method, headers and request body. More.
TCP port
Is the port open and completing a handshake, and how long it takes. More.
ICMP ping
Reachability and round-trip time from every assigned location. More.
TLS certificate
Days until the certificate expires, warned on the days you choose. More.
Domain expiry
Days until the registration lapses, from RDAP or whois. More.
Heartbeat
Your cron job calls us; silence inside the window is the incident. More.
Agent
A machine inside your network reports CPU, memory, disk and network alongside its liveness.
Metric threshold
Alert when a figure from an agent crosses a line you set: disk above 90%, load above 8.
SNMP
Switches, routers, UPS units and NAS boxes, polled by an agent. More.
Passive agent check
HTTP, TCP and ICMP checks executed by your agent instead of by our probes, for private targets.
The map
The network map
PingFleet draws hosts, services and the links between them and colours the graph live. You place the nodes once; the arrangement is yours.
The map has an embeddable mode with no navigation and no chrome, for a wall display or an iframe in somebody else's dashboard.
Everything else
The rest of the platform
Status pages
A public page on a slug or your own domain, publishing the monitors and incidents you choose. More.
Alert groups
Escalation steps with their own hours, built once and reused. More.
Check locations
Separate providers, separate networks, agreement before anything is called down. More.
Agents
For databases, NAS boxes and anything behind CGNAT. More.
Questions
- What can PingFleet monitor?
- Websites and APIs over HTTP, hosts over ICMP, services on any TCP port, TLS certificate expiry, domain registration expiry, cron jobs by heartbeat, machine metrics through an agent, and network devices over SNMP.
- Do I need an agent?
- Only for things the public internet cannot reach. Anything with a public address is checked by the fleet with nothing to install.
- What is the map for?
- It records what depends on what. When a database goes red, the services sitting behind it are visibly the next thing to fail, which a list of rows cannot show you.
- Can I put a screen on the wall?
- Yes. There is a TV mode with no controls, and the map has an embed mode with the navigation removed.
- Is there an API?
- Not a documented public one yet. Heartbeat endpoints are URLs you call, and status pages are public HTML, so both are usable from a script today.