Your health check says OK while your database is down
Fix a health check that misses database failures
Your monitor sees nothing wrong
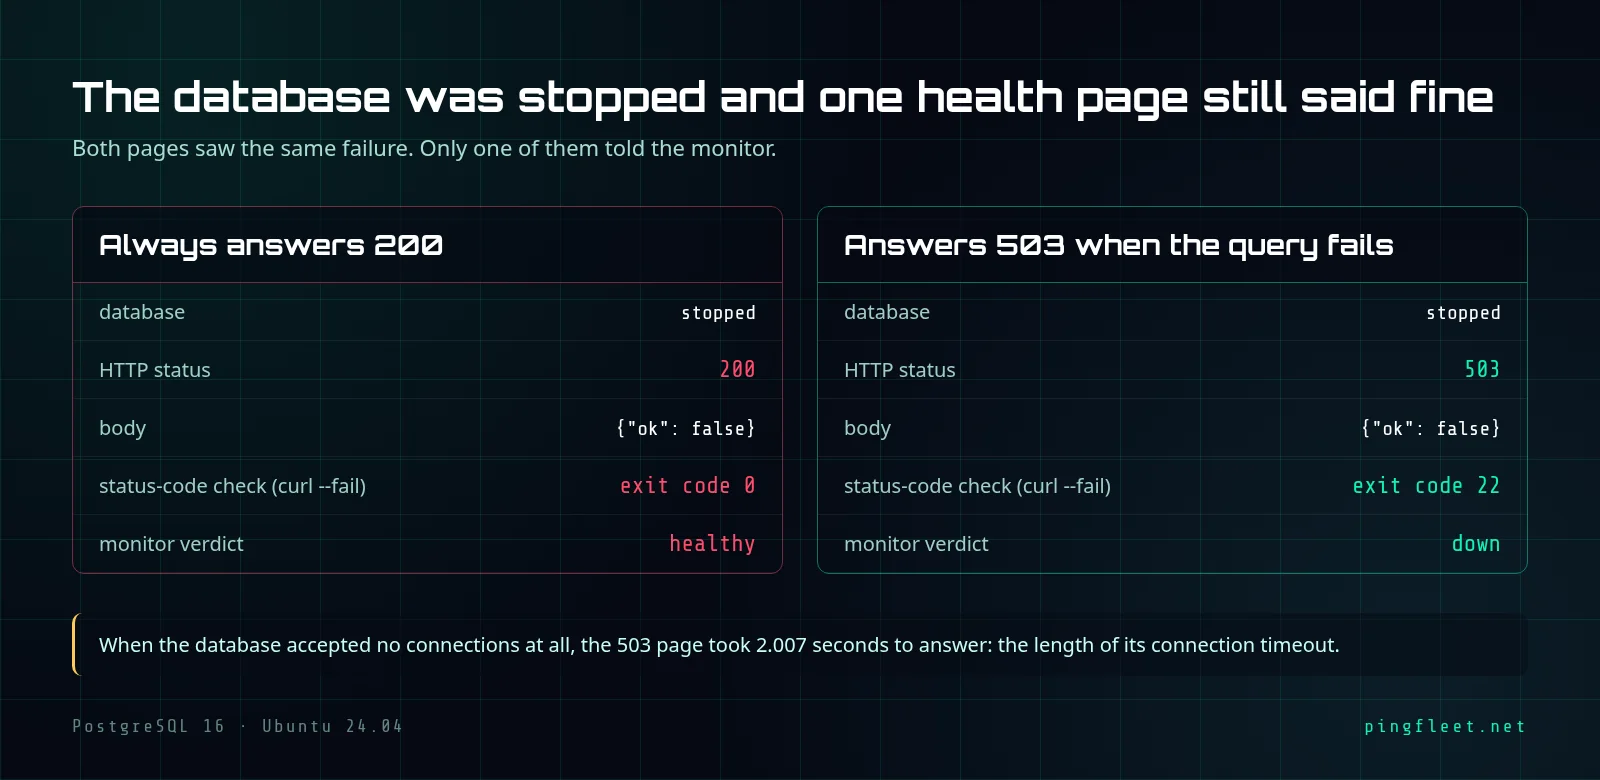
I stopped PostgreSQL on a test VM and loaded the health check page. It said HTTP 200. The JSON body said the database connection had failed, but the status code told any polling service that everything was running fine and nothing needed attention.
Any monitoring service checking that page would record HTTP 200 and move on. Nothing looked wrong. On a live site, visitors could see errors while the monitor kept reporting the page as healthy.
Why does a 200 fool the monitor?
A status-code monitor sends an HTTP request and reads the number that comes back. It ignores the body. HTTP 503 means the service is unavailable, and that is the response a health check should send when something it depends on has stopped working.
I ran 2 health check pages on the same test VM, both querying PostgreSQL for a single row. The always-200 page returned HTTP 200 no matter what. Dead database, live database, same 200. The 503 page returned HTTP 503 when the query failed. Using curl with its fail-on-error flag, the always-200 page produced exit code 0 and the 503 page produced exit code 22, which is how a status-code monitor tells a healthy service from a broken one.

One line of code changed exit code 0 to exit code 22.
The fix is one line of logic
When the health check catches a database error, it should answer HTTP 503 instead of 200. That is the entire fix. The JSON body still carries the error detail, and the difference between the 2 test pages was a single line that checks the query result before choosing the status code.
I assumed the JSON body was enough. It was not. With the body reporting a failure and the status still 200, the exit code from the fail-on-error test was 0, meaning success. A monitor that checks the status code would report the same thing. You could configure a monitor to search the response body for a specific string, but that is a different kind of check.
A hanging database takes longer to catch
When PostgreSQL is stopped, the operating system refuses the TCP connection and the health check answers HTTP 503. A firewall dropping packets is different. There is no refusal, so the health check sits and waits for the connection attempt to time out.
I blocked port 5432 on the test VM with a firewall rule that dropped all TCP traffic to that port, simulating a database server that was unreachable but not explicitly refusing connections. The 503 page answered HTTP 503 in 2.007 seconds. That matched the 2-second connection timeout set in the database connection string.
I think a 2-second connect timeout is right for most health check pages. If the database has not answered in 2 seconds, you want the monitor to report it on the next poll, not a minute later.
What to check on your own page
Open your health check URL in a browser and stop the database. Reload. If the page still returns HTTP 200, your monitor will not catch the outage.
When I restarted PostgreSQL during the test, the 503 page returned HTTP 200 without any extra step. The status code went back to 200 once the database accepted connections again.
For those who want the details
The test ran on Ubuntu 24.04.5 LTS with PostgreSQL 16.15. One disposable test VM, 2 HTTP servers. Port 8081 always returned 200, port 8082 returned 503 when the query failed. The code difference was one expression:
- self.send_response(200)
+ self.send_response(200 if body["ok"] else 503)
With PostgreSQL running, both pages returned HTTP 200 and an identical JSON body. After stopping PostgreSQL, the results differed.
The always-200 page on port 8081 kept returning HTTP 200. The body reported the error, but the status code did not change:
HTTP 200
{"ok": false, "error": "connection to server at \"127.0.0.1\", port 5432 failed: Conne"}
The 503 page on port 8082 returned HTTP 503. Same body, different status code:
HTTP 503
{"ok": false, "error": "connection to server at \"127.0.0.1\", port 5432 failed: Conne"}
The curl -sf exit codes confirmed the difference. Exit code 0 means no HTTP error detected, 22 means the server returned an error:
curl -sf localhost:8081 >/dev/null; echo $?
0

curl -sf localhost:8082 >/dev/null; echo $?
22
To simulate a database that hangs instead of refusing connections, a firewall rule blocked TCP traffic to port 5432. The rule applied to the loopback interface:
sudo iptables -I INPUT -i lo -p tcp --dport 5432 -j DROP
The 503 page then answered HTTP 503 in 2.007 seconds. The time output:
real	0m2.007s
user	0m0.003s
sys	0m0.001s
The 2.007 seconds match the connect_timeout=2 parameter in the PostgreSQL connection string. After restarting PostgreSQL, the 503 page returned HTTP 200:
HTTP 200
{"ok": true}
The -s flag suppresses progress output. The -f flag makes curl exit with code 22 instead of 0 when the server returns an HTTP error, which is the same distinction a status-code monitor draws.