Network intelligence
Uptime monitoring and network intelligence
Know what broke, where, and what it takes with it. Checks from independent networks, agents inside your own, and a live map of how it all connects.
20 monitors free, for as long as you like. No card.
operational degraded down, and what it takes with it. Drag a node.
The map
The network map
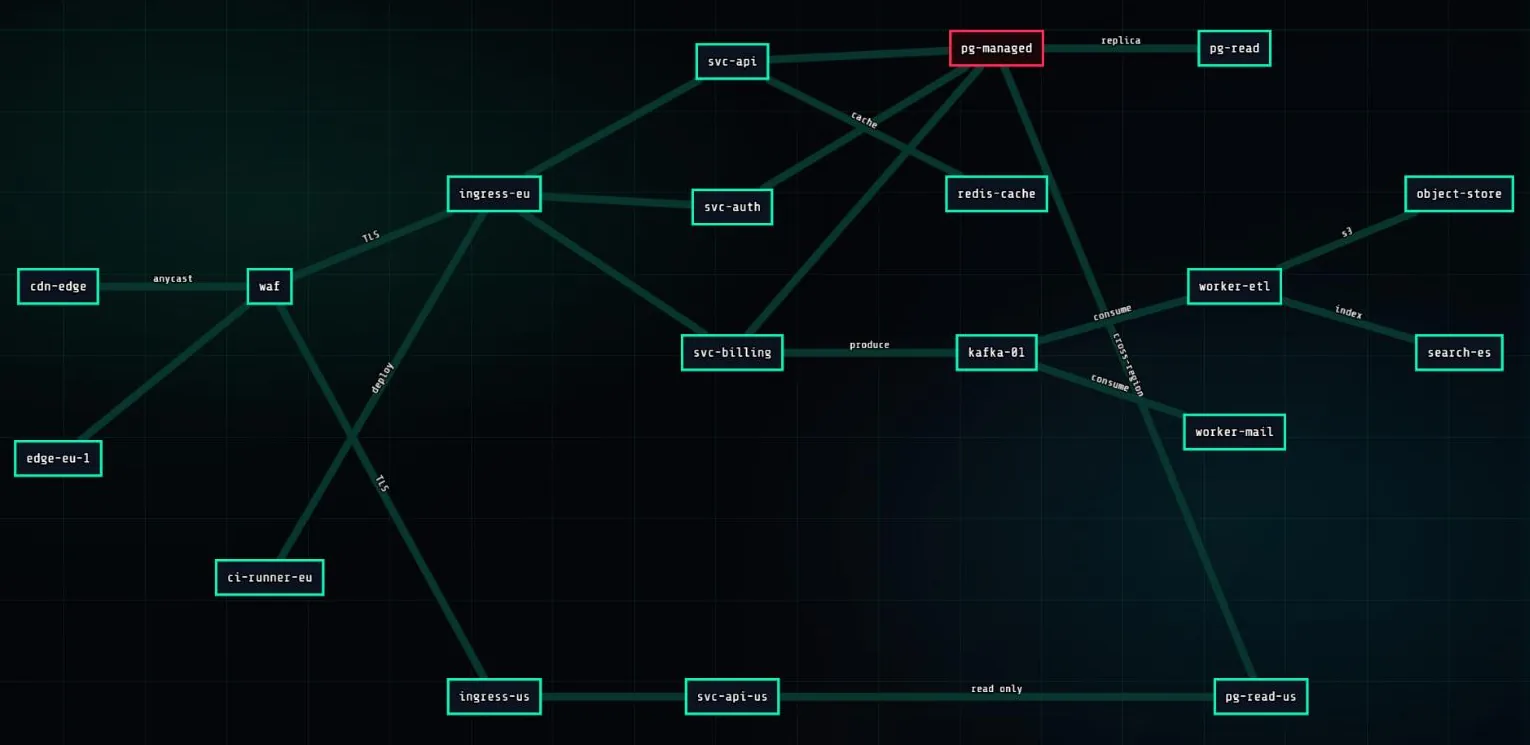
A list tells you what is red. It does not tell you what that red thing sits behind, or which four services are about to follow it.
You place the nodes once. Only you know which of two boxes everything else leans on.
- Live status on every node and link
- Waypoints for the hops between two monitored things
- An embed mode with no navigation, for a wall display
Dashboard
Everything, on one screen
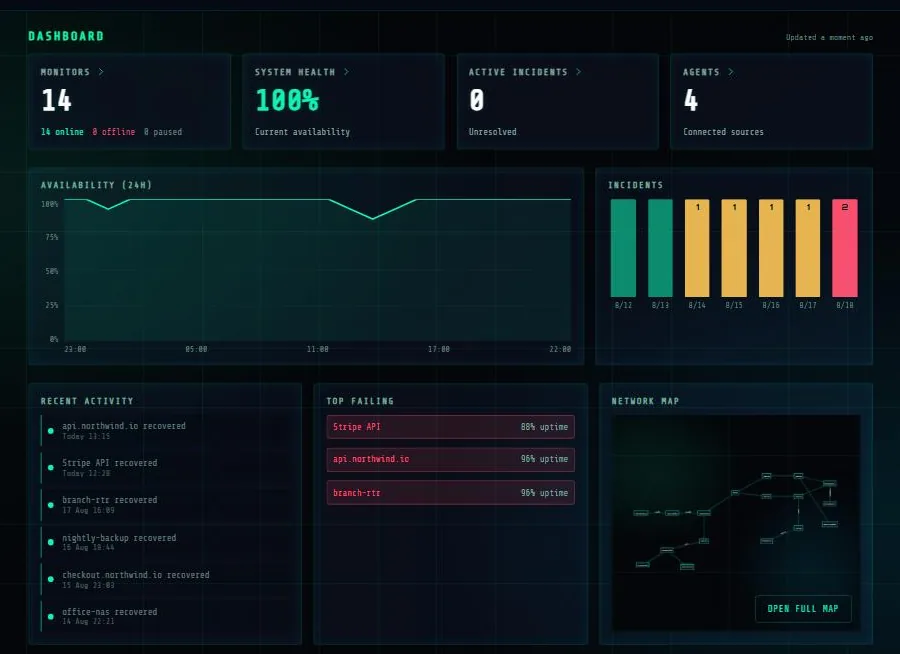
Availability across the last 24 hours, incidents per day, recent activity, the worst monitors, and the map. Hover an hour to see which monitors were down or degraded in it.
Alerting
Alert escalation
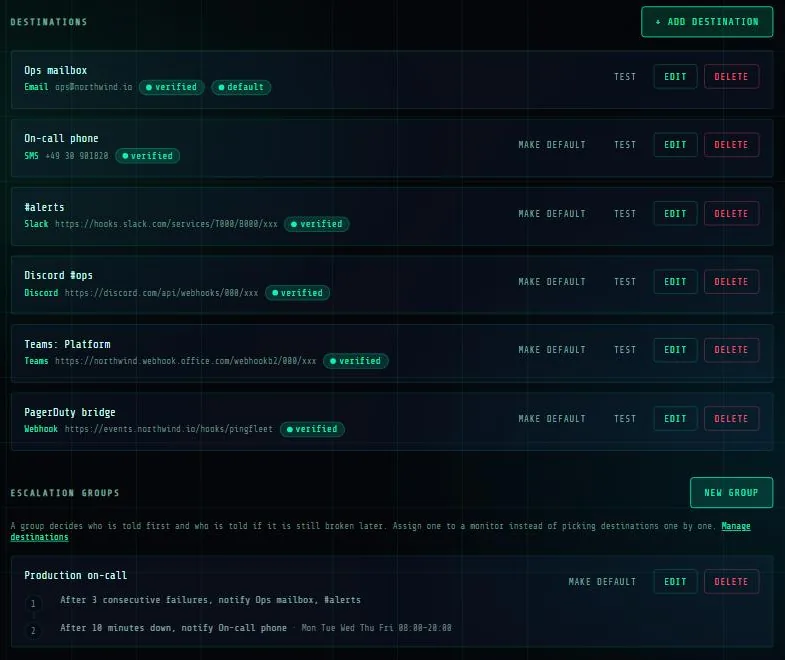
Six ways to be told: email, SMS, Slack, Discord, Microsoft Teams, and a webhook to anything else you already run. Each destination is verified once and then reused.
Three consecutive failures: email to the ops mailbox and a message in #alerts. Still down ten minutes later: a text message to the on-call phone, but only between 08:00 and 20:00, Monday to Friday, in your timezone.
That is the entire configuration. It is one group, and it is attached to all forty monitors.
The escalation
Steps, hours, and who is woken
A step names the destinations it fires, how long after the previous one, and the hours in which it is allowed to wake somebody. Nights and weekends are a checkbox, not a separate product.

Incidents
Incident management
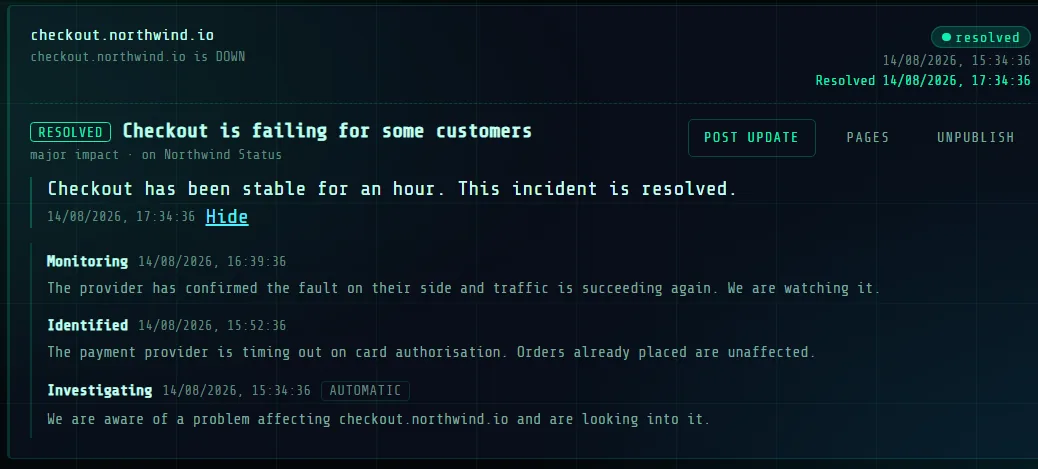
An incident opens the second a check fails, and stays private until you publish it. The words are drafted for you; you change them before anyone reads them.
- Publish to one status page, several, or all of them
- Subscribers confirm by email before anything is sent to them
- Recovery is posted as an observation. Only you write "resolved"
Status pages
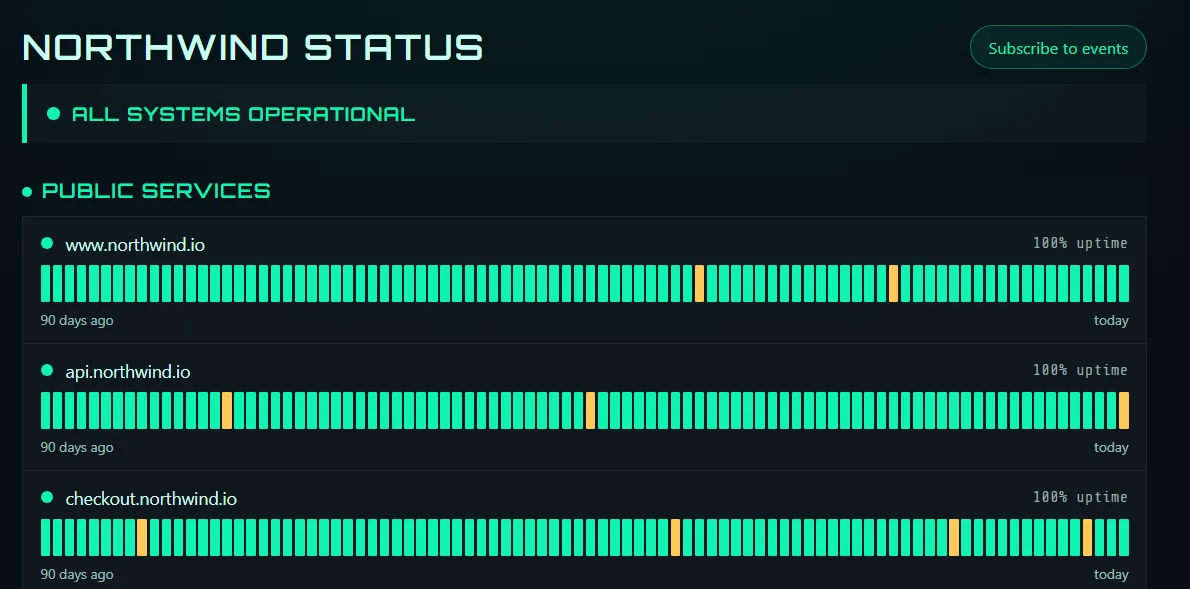
Public status pages
Every service and every incident is opt-in.
- Your own domain, verified by DNS before it is served
- Ninety-day uptime bars, from the stored checks
- Two designs, chosen with a live preview
Agents
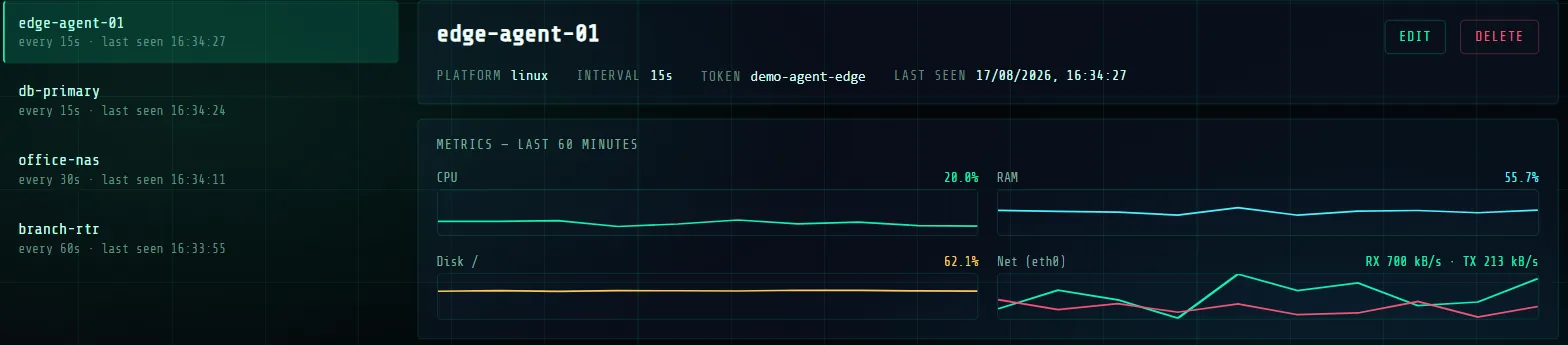
Agents for private networks
Databases on private subnets, an office NAS, a router behind CGNAT. The agent checks them locally and reports outward, with no inbound rules and no open ports, and sends CPU, memory, disk and network from the machine it runs on.
- Linux, Windows, MikroTik RouterOS and Docker
- One agent on the free plan, 25 on Pro
Monitor types
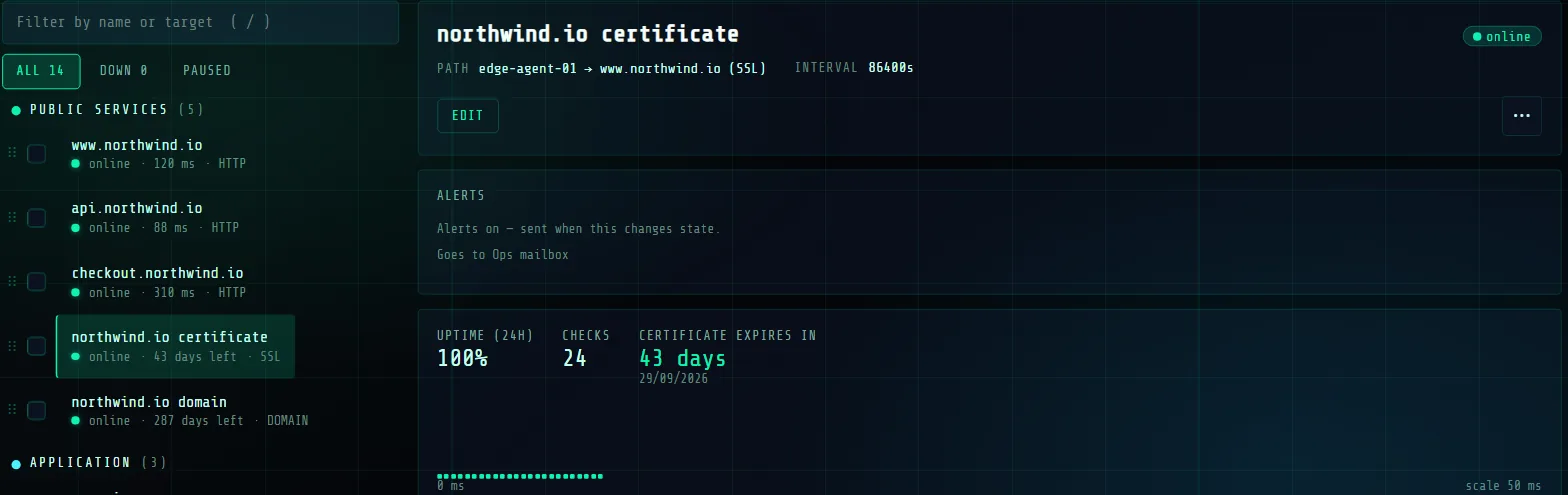
Ten monitor types
Not one generic check bolted onto everything.
- Website, ping and port checks
- Certificate and domain expiry, on your thresholds
- Cron heartbeats, SNMP, and agent metrics with thresholds
The fleet
The probe fleet
Checks run from separate providers on separate autonomous systems, so that two of our machines cannot share one network's bad day. Every address is published at /ips.json, as a file you can paste into a firewall rule.
Marked points are the machines that run checks. The arcs are checks leaving them for targets elsewhere, not places we check from.
Dependencies
What a dependency failure looks like
Watch it happen.
down degraded. This is the second the map earns its place.
Consensus
Consensus between locations
Questions
- What can PingFleet monitor?
- HTTP and HTTPS endpoints, TCP ports, ICMP ping, TLS certificate expiry, domain registration expiry, heartbeats from cron jobs, metrics and thresholds from agents, and SNMP devices.
- Do I need to open a firewall port for the agent?
- No. The agent connects outward to PingFleet and reports its results. Nothing needs to be reachable from the internet.
- Which addresses do the checks come from?
- Every probe address is published at pingfleet.net/ips.json and pingfleet.net/ips.txt, so you can allow-list them in a firewall.
- Is the free plan a trial?
- No. It does not expire and does not ask for a card. It checks from one location; paid plans check from several and require agreement between them.
- How long is history kept?
- Individual check results are kept for 90 days, which is where the 90-day figures on status pages come from. Agent metrics are kept for 30 days.