Alert before the disk fills, not after the database dies
At 23% used the disk had four hours left
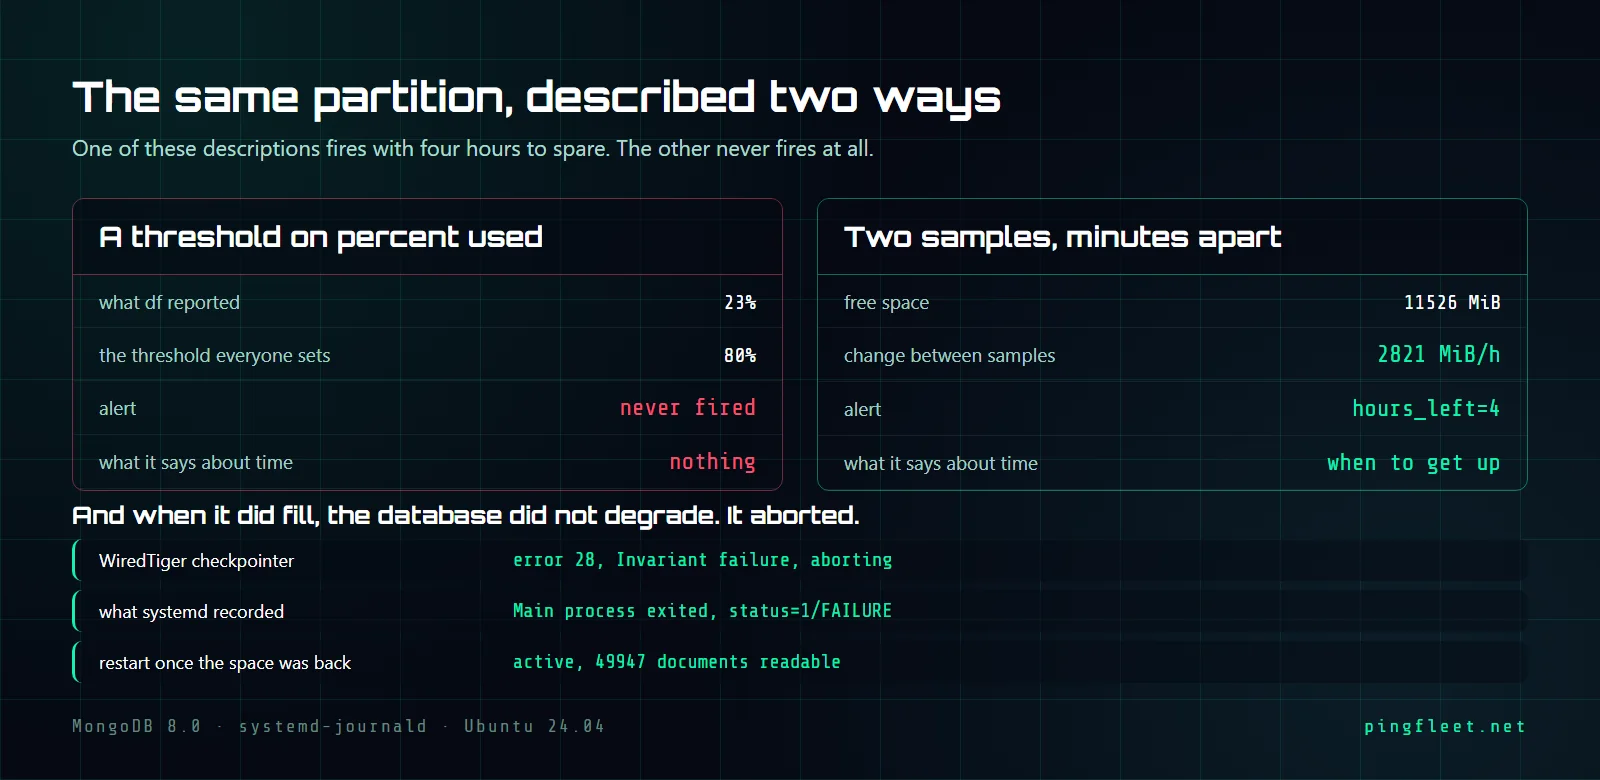
df says 23 percent used. The partition is 15G. An alert set to fire at 80 percent would sit quiet for weeks, but something is writing 4 MiB every five seconds, and two df readings taken three minutes apart give rate=2821MiB/h, hours_left=4.
I ran this on a fresh Ubuntu 24.04.4 VM, kernel 6.8.0-137-generic, with /dev/sda1 at 15G and MongoDB 8 from the official apt repository. The check script at the end would have fired at hours_left=4. The percentage threshold had nothing to say.
MongoDB 8 aborts on a full disk
I filled the partition to the last 5.3 MiB. WiredTiger's Checkpointer thread tried to flush a checkpoint, got error 28 (ENOSPC), and raised an invariant failure. Here is what mongod logged.
{"s":"E","c":"WT","id":22435,"ctx":"Checkpointer",
 "msg":"WiredTiger error message","attr":{"error":28}}
{"s":"F","c":"ASSERT","id":23083,"ctx":"Checkpointer",
 "msg":"Invariant failure",
 "attr":{"expr":"session->checkpoint(session, \"use_timestamp=false\")"}}
{"s":"F","c":"ASSERT","id":23084,"ctx":"Checkpointer",
 "msg":"***aborting after invariant() failure"}
mongod aborted the moment WiredTiger could not write.
systemd recorded mongod.service: Main process exited, code=exited, status=1/FAILURE. I tried restarting mongod with the disk still at 100 percent. It would not start. WiredTiger could not open its storage files with 0 bytes free.
After I deleted the fill file and freed /dev/sda1 back to 22 percent, mongod started. WiredTiger replayed its recovery journal. The ***aborting after invariant() failure message looked like it would mean corruption, but all 49947 documents were readable without repair.
Why did journald get 240 megabytes on a 15-gigabyte disk?
With no explicit SystemMaxUse= set, journald defaults to 10 percent of the filesystem, capped at 4G. On /dev/sda1 at 15G, 10 percent is 1480 MiB, and after a fresh restart journald confirmed it with max 1.4G. But the first systemd-journald on this VM logged a different number. At 16:13:08, PID 297 reported max 240.8M.
PID 297 started at 16:13:08. Six seconds later, cloud-init resized ext4 from 655099 to 3931899 blocks at 16:13:14, but by then journald had already read the partition at its template size and locked in max 240.8M, a number it never revised.
I assumed the cap would adjust. It does not. On a machine where nobody restarts systemd-journald explicitly, the 240.8M limit from a pre-resize disk stays until the next reboot, and after reboot the new default silently jumps to 1.4G.
Ubuntu 24.04 ships one journald drop-in at /usr/lib/systemd/journald.conf.d/syslog.conf with ForwardToSyslog=yes and does not touch SystemMaxUse. I created /etc/systemd/journald.conf.d/cap.conf with two settings.
[Journal]
SystemMaxUse=300M
MaxRetentionSec=30day
After systemctl restart systemd-journald, the log confirmed max 300.0M, 258.8M free. That is 300 MiB reserved for the journal on a 15G partition, and the remaining space belongs to whatever shares /, including MongoDB's data directory at /var/lib/mongodb.
The script stores one number
I think most 80 percent disk alerts exist because 80 is the default in whatever monitoring tutorial showed up first, not because anyone calculated what 80 percent of their specific partition means in hours at their actual write rate. On this VM, 23 percent used and four hours from dead were the same moment.
The script stores one reading in /var/tmp/: MiB free and a Unix timestamp. On the next run it compares that against the new reading and converts the difference to MiB per hour. A positive rate means it also prints hours_left. These are three consecutive runs from the test, each about three minutes apart, with a process leaking 4 MiB every five seconds between the first two.
mount=/ used=22% free=11671MiB
mount=/ used=23% free=11526MiB rate=2821MiB/h hours_left=4
mount=/ used=23% free=11526MiB
The first run has no history. It prints only what df already knows. The second sees 145 MiB gone in roughly 185 seconds and computes rate=2821MiB/h; dividing 11526 by 2821 gives hours_left=4. After the leak stopped, the third run sees zero delta, so rate is absent.
#!/usr/bin/env bash
mount="${1:-/}"; state="/var/tmp/disk-rate${mount//\//_}"
now=$(date +%s)
free=$(df -BM --output=avail "$mount" | tail -1 | tr -dc '0-9')
pct=$(df --output=pcent "$mount" | tail -1 | tr -dc '0-9')
out="mount=$mount used=${pct}% free=${free}MiB"
if [[ -f $state ]]; then
  read pt pf < "$state"
  rate=$(( (pf - free) * 3600 / (now - pt) ))
  (( rate > 0 )) && out+=" rate=${rate}MiB/h hours_left=$((free / rate))"
fi
echo "$out"; echo "$now $free" > "$state"
Run it from cron every 2 or 3 minutes and alert when hours_left drops below whatever gives your on-call enough time to act. On this 15G VM, hours_left=4 was plenty of time if someone was watching, and a disaster if nobody was.
While the disk was full, systemd-journald could not open user journal files and fell back to the system journal, logging No space left on device. That does not matter here. The check script calls df directly and does not depend on the journal being healthy.